Background
The Dashboard is part of ongoing work that is currently being completed at the Institute of Accounting, Control and Auditing of the University of St. Gallen. The research deals with continuous assurance (CA) and how this new audit methodology can be moved from theoretical work to practical applications. CA is defined by the Institute of Internal Auditors (IIA) as the combination of audit testing of continuous monitoring (CM) combined with continuous auditing by the audit function:
Continuous auditing comprises ongoing risk and control assessments, enabled by technology and facilitated by a new audit paradigm that is shifting from periodic evaluations of risks and controls based on a sample of transactions, to ongoing evaluations based on a larger proportion of transactions. Continuous auditing also includes the analysis of other data sources that can reveal outliers in business systems, such as security levels, logging, incidents, unstructured data, and changes to IT configurations, application controls, and segregation of duty controls. (GTAG 3, p. 1)
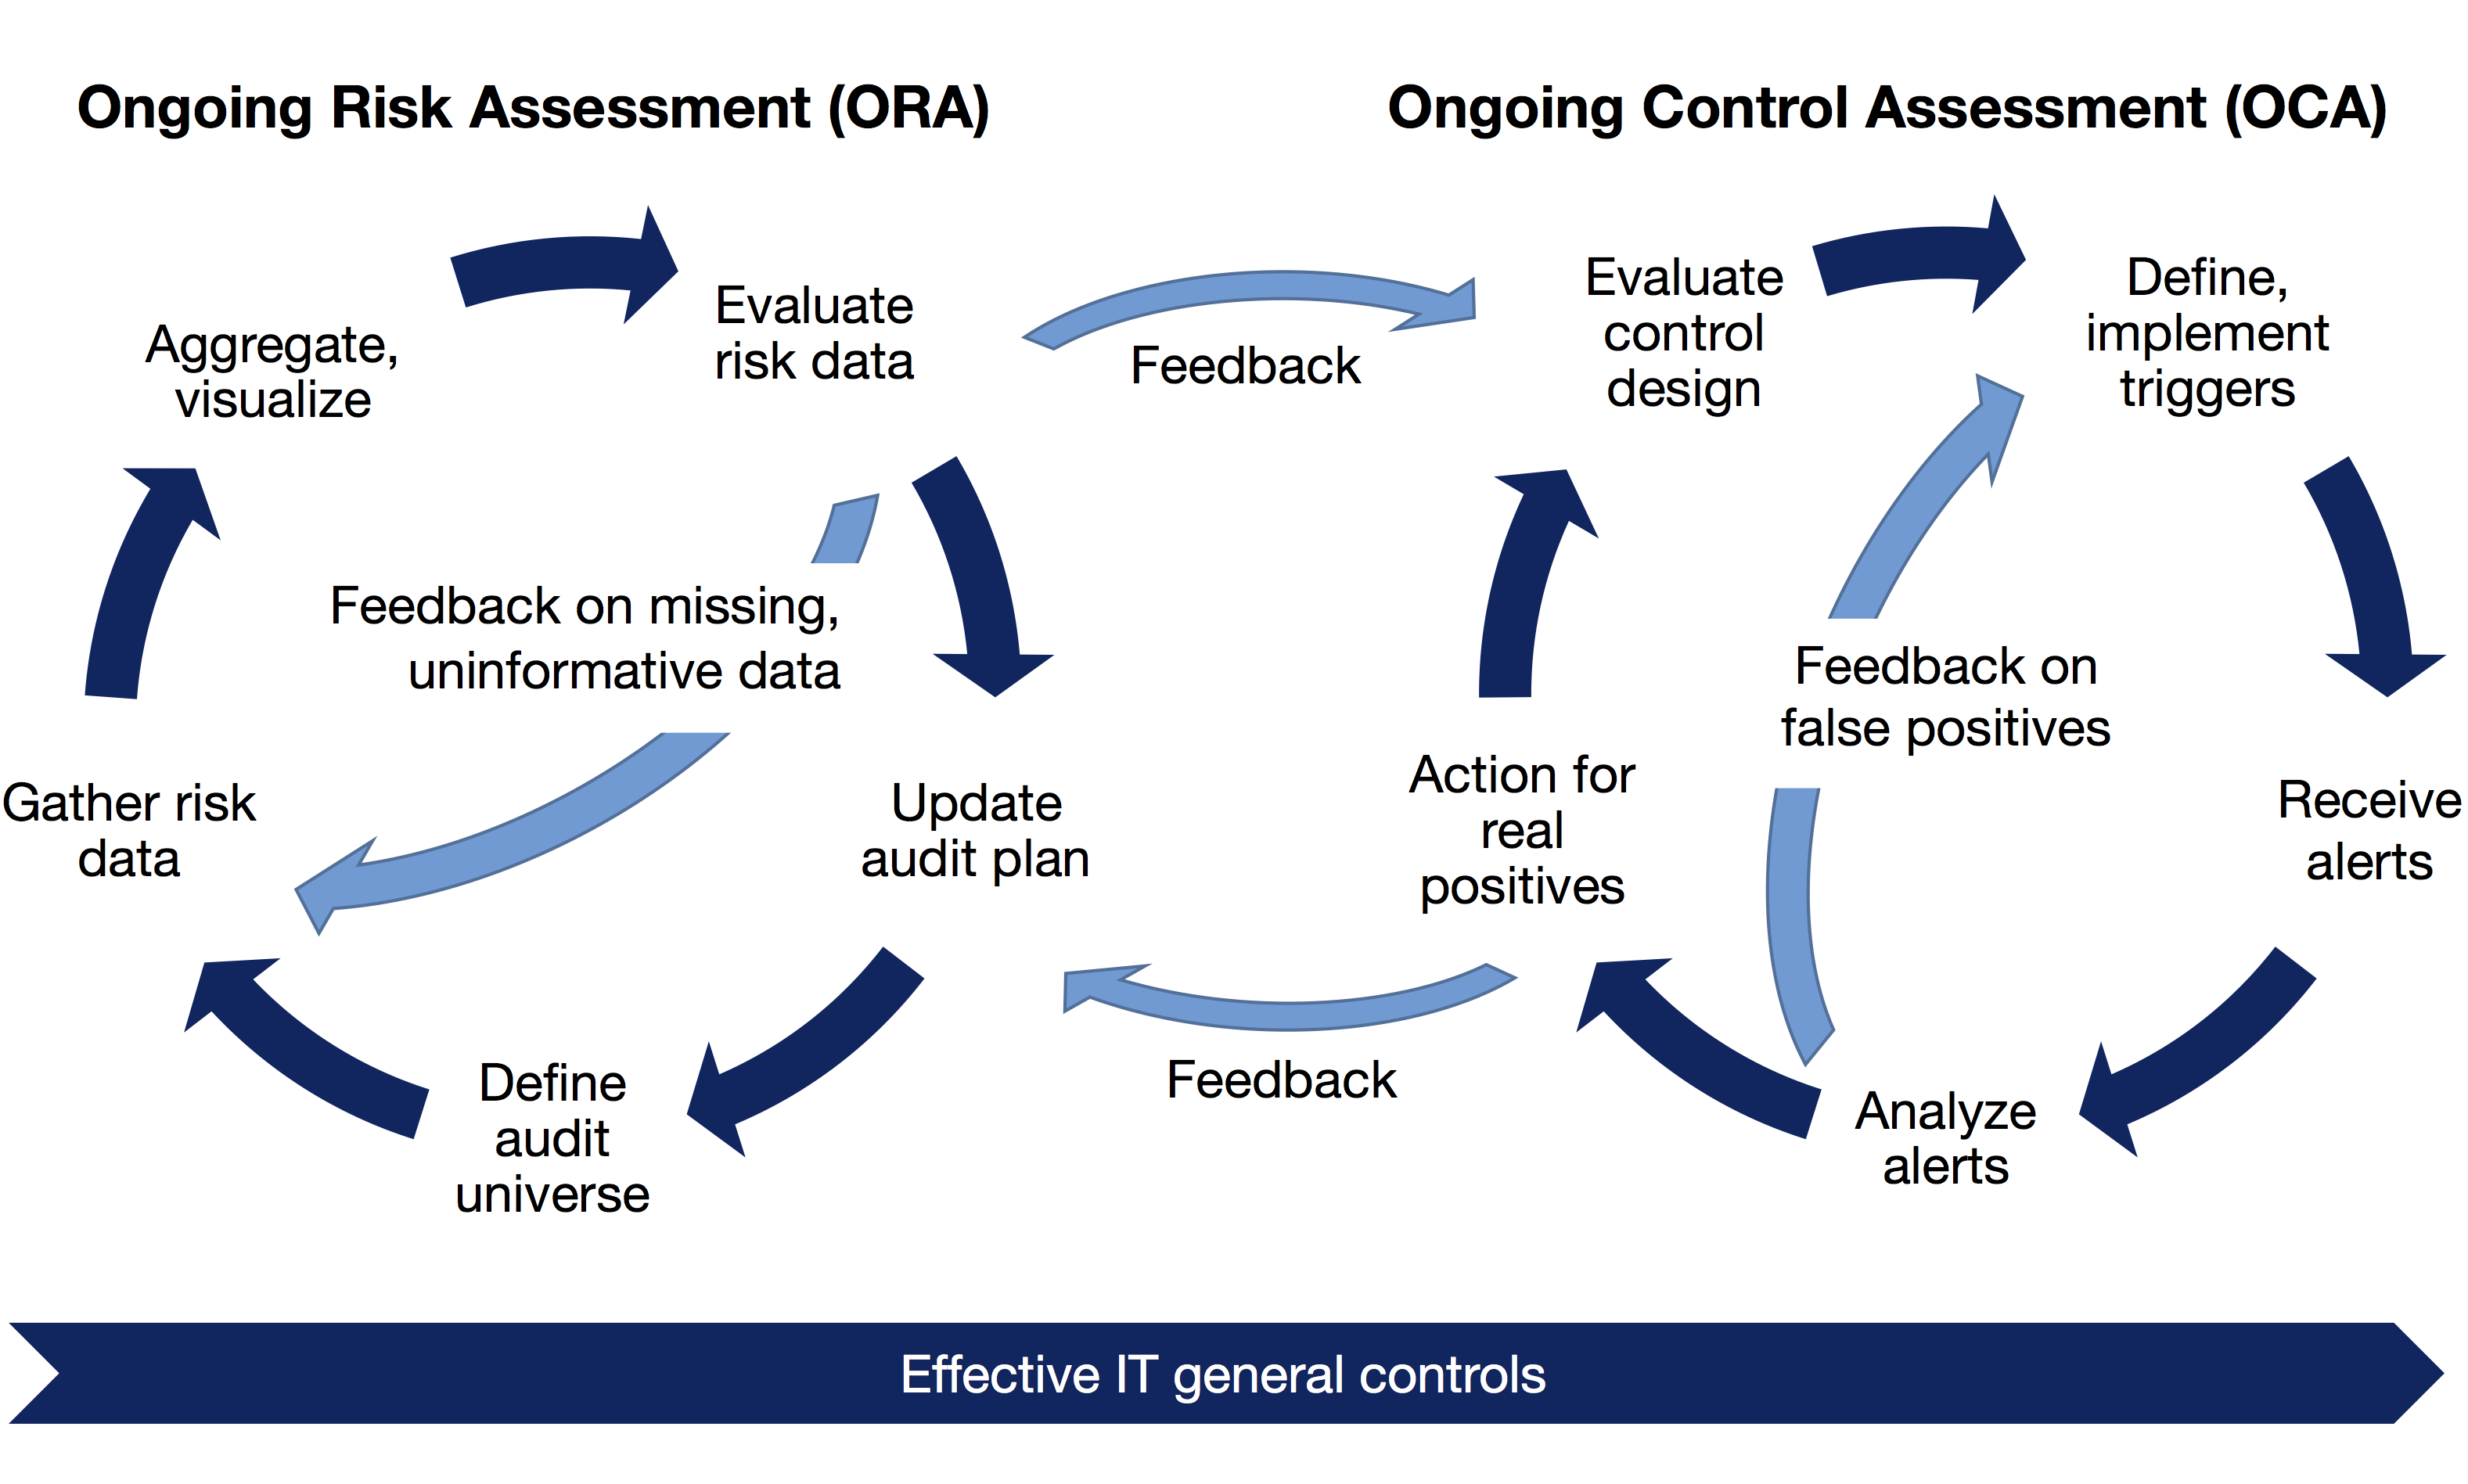
We follow the definition of the IIA in our research by separating continuous auditing into Ongoing Risk Assessments (ORA) and Ongoing Control Assessments (OCA).

ORA is the continuous version of the “at least annual” update of the audit plan required by IIA Standard 2010.A1. ORA is a tool for audit planning – it is a means to spend audit resources on the most high-risk areas, recognizing that risks can shift quickly and planning must thus also be dynamic throughout the year.
OCA moves audit procedures out of one-off audits and into an ongoing process. As with all audit procedures, OCA relies on an assessment of objectives to be achieved and of risks that might affect achievement of objectives (IIA Standard 2201). Based on the risk assessment, the effectiveness of control design can be evaluated (as in regular audits). If a control’s design is ineffective, there is no point in testing whether it is working as designed. If control design is judged to be effective, triggers can be defined and implemented that utilize data to evaluate whether the control is working effectively on an ongoing basis. In general, these triggers will lead to alerts that can then be analyzed. It is rare to find triggers where each alert corresponds to a control violation warranting action. Most triggers will lead to false positives, especially for newly set-up continuous auditing procedures (“alarms floods”; Alles et al., 2008, p. 205). Thus, it is necessary for humans to analyze the alerts generated. If the analysis leads to real findings, the process follows regular audit processes: Action plans need to be agreed by management and tracked by auditors for follow-up (IIA Standard 2500.A1). In many cases, however, follow-up will effectively be conducted by continuing to run the OCA procedure (Mainardi, 2011, p. 169): If the mitigating actions are implemented effectively, the number of alerts from the OCA procedure should be sustainably reduced.
Note that OCA is just one approach of many to achieve assurance and can co-exist with regular audits, control self-assessments and other methods to evaluate the effectiveness of risk management, control, and governance processes. The audit plan will define which risk areas are best addressed using OCA and which using traditional methods.
Technical stack for CA
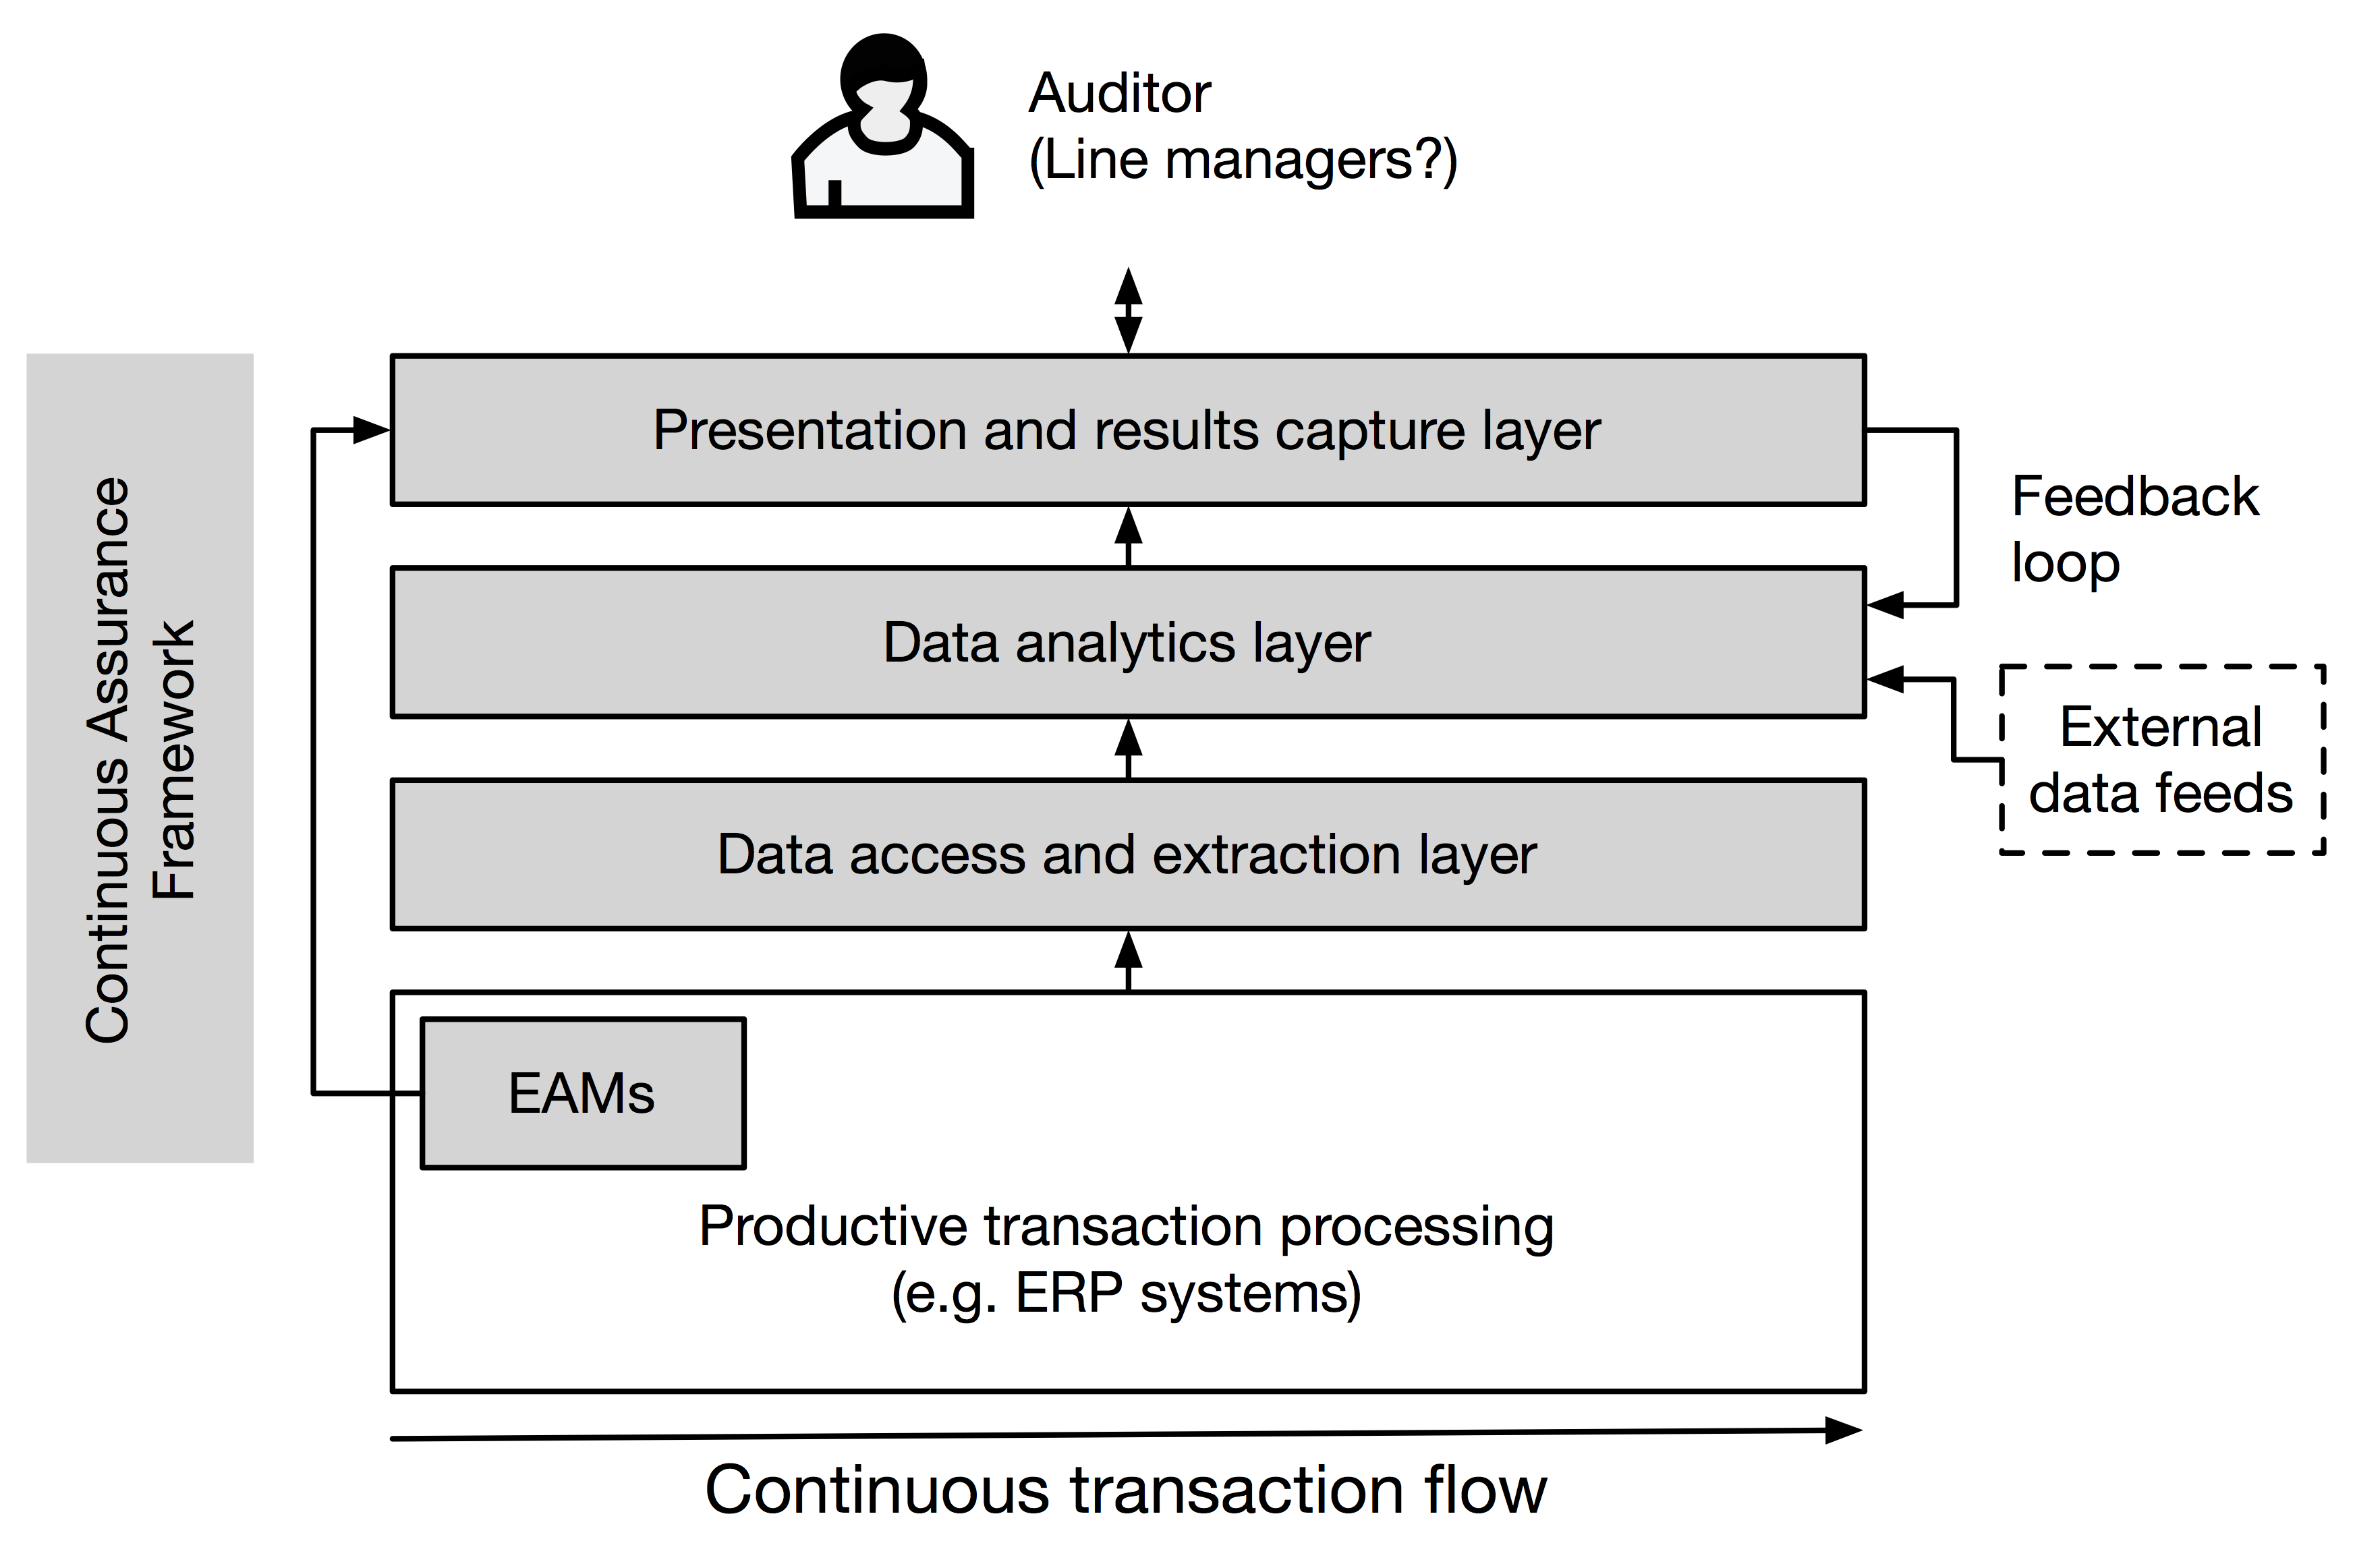
CA is based on the abundance of data produced by corporate IT systems, including but not limited to the company-wide ERP systems. For using this data, two approaches are feasible: either data can be extracted (on a regular schedule or as a “live feed”) from these systems and analyzed in a separate CA data analytics environment, or data can be analyzed and processed directly inside the relevant systems (see Vasarhelyi et al., 2010, pp. 44-45, for a discussion, including advantages and disadvantages of each option). The latter is known as embedded audit modules (EAMs) as it requires CA code to be embedded into the production systems (Murthy & Groomer, 2004). While the focus in most CA implementations is on analyzing internal data, CA does not need to be limited to this – CA analytics can also leverage external data feeds. In either case, the resulting analyses need to be presented to the recipient (auditor and/or line management) and feedback on the results needs to be captured (e.g. which results were false positives and for which results action has been taken). This presentation and data capture layer can be as simple as a Microsoft Excel spreadsheet or it can utilize dedicated dashboard and visualization tools. Feedback on the results needs to be captured and stored as supporting evidence (IIA Standard 2330). The advantage of capturing feedback within the CA environment is that it enables a feedback loop – deploying manual adjustments or automated machine learning techniques, the feedback can be fed back to adjust the data analytics, potentially increasing accuracy and decreasing false positives. A high-level, generalized view of the resulting technical stack can be seen below:

More detailed architectures have been suggested in the literature, but they usually generalize well to this high-level view (see Baksa and Turoff, 2011, pp. 239-240, who reference various suggestions for CA architectures and also note - in line with our overview - that in “its simplest form, the continuous assurance system architecture requires only a digitised data source, well-defined data validation engine, and an alarm and/or reporting mechanism to alert the appropriate parties when these rules are violated”). Our work on The Dashboard is informed by this technical view.
The Dashboard - A framework to close the feedback loop
The Dashboard, the software tool described on this website, is our attempt to develop a “Presentation and results capture layer” as depicted above and in this way improve our understanding of how such a layer can and should work. By providing a modern, web-based interface that follows the IIA definition of CA methodology, we also hope to improve the perceived ease-of-use and usefulness of CA systems for auditors. Following technology acceptance theory (e.g. the Technology Acceptance Model) this should increase intention to use of CA technology.
The Dashboard implements the CA process depicted above. It displays alerts and data generated by existing audit analytics platforms and allows auditors to capture their conclusions on individual data points directly within the system, including any supporting evidence. This data capture interface supports IIA Standard 2330 in a CA context and closes the feedback loop which is a prerequisite for using human auditor’s conclusions to drive machine learning algorithms. With this in place, it becomes feasible to evaluate whether machine learning algorithms can actually effectively reduce “alarm floods” in CA systems.
By focussing not on generating alerts (which depend on the specific systems, policies and procedures in place at a specific company) but on presenting alerts to the user and on the “feedback loop”, the research aims to address the “process for handling alarms which is clearly a very complex subject that warrants further research” (Alles et al., 2008, p. 205). It would also counteract Baksa and Turoff (2011)’s observation that current approaches have “neglected the real-time response, which incorporates real-time human decisions, the measurement of the impact of those decisions and the determination of the effect of the responses” (p. 241). In a similar vein, Vasarhelyi et al. (2010, p. 21) find that while “ERPs bring together applications in common databases the area of automated work papers (and its obvious core database) is primitive to say the least. […] The main sharing mechanisms currently used are office automation tools (eg. MS Office) which are powerful but not adapted to the dynamic needs of the assurance process”. A reference framework such as The Dashboard might also help to provide a common understanding of what CA means by implementing an established methodology.
We have implemented The Dashboard on top of SharePoint, a common platform in large enterprises, to make it as easy as possible to introduce in audit departments worldwide. By letting the existing SharePoint platform handle user authentication and access restrictions we also account for the fact that audit systems will contain potentially sensitive information that needs to be kept secure at all times.
Additional background
If you require additional theoretical background on our implementation of The Dashboard, feel free to get in touch.